
Use calculator nowRead the sun hours guide ↓
Peak Sun Hours by State: Map, Table & Calculator
Find your state's peak sun hours on our NREL-based map and table, then use the free calculator to estimate how much solar power you'll produce each year.
California averages about 5.6 peak sun hours per day (annual average). That's the number that turns panel wattage into real energy.
450 W is a typical modern residential panel — a good default.
Get a free, accurate estimate on a complete self-install solar kit — professionally sized for your roof, code-ready, and backed by a real team for permits, interconnection, and lifetime support. You install it yourself and keep the savings; we've got your back the whole way. Takes a couple minutes and you get a real price + a free report.
Estimate only, for planning. Actual production varies with roof orientation, tilt, shading, temperature, soiling and equipment. Uses a standard ~80% system derate on the DC nameplate; the range spans roughly 74–88%.
Peak Sun Hours Calculator: Estimate Your Solar Production
Use this quick, interactive estimate to see roughly how much power a solar array would produce in your state. Pick your state, choose how many panels you'd install, and get a ballpark system size and yearly output.
How it works (the calculator does this math for you):
- Pick your state → the tool fills in your average peak sun hours from the NREL table below.
- Choose your panels → the default is a 450-watt panel, a common, efficient size for residential roofs. Drag the slider from a few panels up to a full roof.
- See your result → the tool shows your system size (kW) and an estimated annual production range (kWh/year).
The formula under the hood:
The derate factor is the real-world "reality tax" — wiring losses, inverter efficiency, heat, dust, and imperfect angles knock roughly 15–25% off the textbook number.
Worked example: 10 × 450-watt panels = a 4.5 kW system. In a 5-PSH location:
- Textbook: 4.5 kW × 5 PSH × 365 = 8,213 kWh/year
- Realistic (× 0.80): ≈ 6,570 kWh/year
That's enough to cover a big share of an average U.S. home's ~10,800 kWh annual use.
This is a ballpark for planning and budgeting only — see why it's just a starting point below. When you want a number tuned to your actual roof, get a free solar estimate.
What Are Peak Sun Hours?
A peak sun hour is one hour of sunlight at an average intensity of 1,000 watts per square meter (1 kW/m²). That's the standard "full sun" intensity every solar panel is tested and rated at, so it's the natural unit for measuring usable solar energy.
Here's the key idea: sunlight intensity changes all day — weak at dawn, strong at midday, weak again at dusk. Peak sun hours repackage that whole day of varying sunlight into an equivalent number of full-strength hours.
- 1 peak sun hour = 1,000 W/m² for one hour = 1 kWh/m² of solar energy.
- The intensities add up. Receiving 500 W/m² for two hours = 1 peak sun hour (500 × 2 = 1,000).
- So if your location gets 5 kWh/m² of sunlight across a day, that's 5 peak sun hours — even though the sun may be up for 12 or more hours.
This is why peak sun hours are the number solar designers actually use: multiply your panel wattage by your peak sun hours and you get a realistic estimate of daily energy, without pretending the sun is at full strength all day.
One distinction worth locking in early: a kilowatt (kW) measures size — how much power your array can make at any instant. A kilowatt-hour (kWh), or "watt-hours" of energy, measures how much it makes over time. Peak sun hours are the bridge between the two: kW × peak sun hours = kWh.
Illustration — What Are Peak Sun Hours? (a day's sunlight curve compressed into equivalent full-intensity hours)
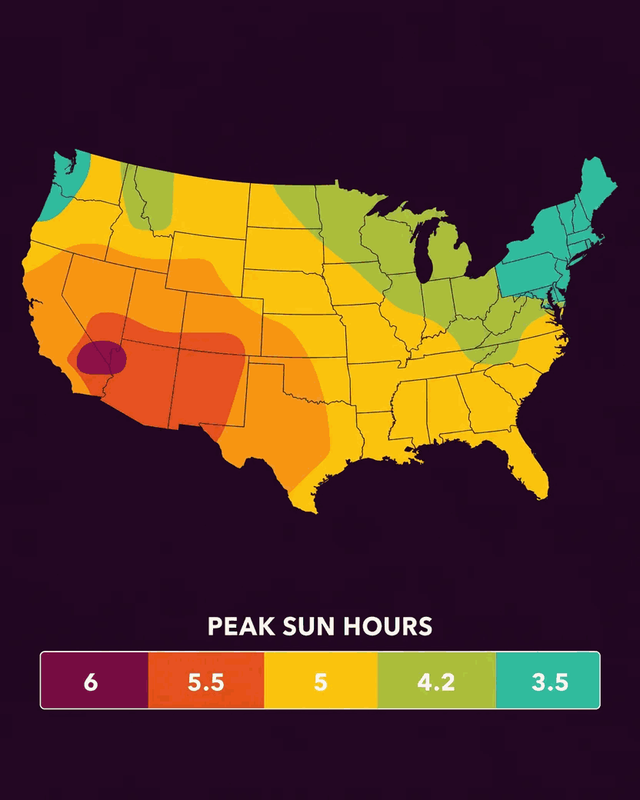
Peak Sun Hours vs. Hours of Daylight (and "What Time Is Peak Sun?")
These get mixed up constantly, so let's separate them cleanly:
- Hours of daylight = every hour the sun is above the horizon (often 10–14+ hours).
- Peak sun hours = the equivalent hours at full 1,000 W/m² intensity (usually 3–6).
Your panels might see 7+ hours of usable daylight but only bank 4–5 peak sun hours, because early-morning and late-evening light is too weak to count for much.
What time is peak sun? Intensity peaks at solar noon — the moment the sun is highest in the sky (which is not always clock noon). The strongest production window is roughly 10 a.m. to 2 p.m. The closer you are to the equator, and the closer to summer, the more peak sun hours you collect.
That low, warm light in the 30–60 minutes after sunrise and before sunset — the golden hour — looks great in photos but is nearly worthless for solar. It's far below the 1,000 W/m² threshold, which is exactly why peak sun hours ignore it.
Average Peak Sun Hours by State
The table below shows the annual average peak sun hours per day for every U.S. state, based on NREL's PVWatts data drawn from the National Solar Radiation Database (NSRDB) — the federal gold standard for U.S. solar irradiance. Values are the same dataset the calculator above uses, so the tool and the table always agree.
| Rank | State | Avg. Peak Sun Hours/Day |
|---|---|---|
| 1 | Arizona | 6.5 |
| 1 | New Mexico | 6.5 |
| 3 | Nevada | 6.4 |
| 4 | Hawaii | 5.8 |
| 5 | California | 5.6 |
| 6 | Colorado | 5.5 |
| 6 | Utah | 5.5 |
| 8 | Florida | 5.3 |
| 8 | Texas | 5.3 |
| 10 | Wyoming | 5.2 |
| 11 | Oklahoma | 5.1 |
| 12 | Kansas | 5.0 |
| 13 | Idaho | 4.9 |
| 14 | Georgia | 4.8 |
| 14 | Nebraska | 4.8 |
| 14 | South Carolina | 4.8 |
| 17 | Louisiana | 4.7 |
| 17 | Montana | 4.7 |
| 17 | North Carolina | 4.7 |
| 17 | South Dakota | 4.7 |
| 21 | Alabama | 4.6 |
| 21 | Mississippi | 4.6 |
| 21 | Missouri | 4.6 |
| 24 | Arkansas | 4.5 |
| 24 | North Dakota | 4.5 |
| 24 | Virginia | 4.5 |
| 27 | Delaware | 4.4 |
| 27 | District of Columbia | 4.4 |
| 27 | Iowa | 4.4 |
| 27 | Maryland | 4.4 |
| 27 | Tennessee | 4.4 |
| 32 | Illinois | 4.3 |
| 32 | Kentucky | 4.3 |
| 32 | Minnesota | 4.3 |
| 32 | New Jersey | 4.3 |
| 36 | Connecticut | 4.2 |
| 36 | Indiana | 4.2 |
| 36 | Maine | 4.2 |
| 36 | Massachusetts | 4.2 |
| 36 | New Hampshire | 4.2 |
| 36 | Oregon | 4.2 |
| 36 | Rhode Island | 4.2 |
| 36 | Wisconsin | 4.2 |
| 44 | Ohio | 4.1 |
| 44 | Pennsylvania | 4.1 |
| 44 | West Virginia | 4.1 |
| 47 | Michigan | 4.0 |
| 47 | New York | 4.0 |
| 47 | Vermont | 4.0 |
| 50 | Washington | 3.8 |
| 51 | Alaska | 3.0 |
National average ≈ 5.0 peak sun hours/day. Any location with 4 or more peak sun hours is generally considered well-suited to solar; below that, you simply add panels or storage to reach your energy goal.
Want your exact number, not a state average? Enter your address in NREL's free PVWatts calculator for location-specific irradiance — or skip straight to a real system estimate and let us pull it for you.
Solar insolation is highest in the Southwest and lowest in the Pacific Northwest and Alaska. Remember that these annual averages produce more power in summer and less in winter; winter daily solar gain can run 25–50% below the yearly figure.
How to Turn Peak Sun Hours Into Solar Production
Once you know your peak sun hours, estimating output is straightforward:
Example: A 6 kW system in a 5-PSH state:
- 6 kW × 5 PSH = 30 kWh (textbook) → × 0.80 = ≈ 24 kWh/day → ≈ 8,760 kWh/year
The derate factor matters. In perfect lab conditions a 1 kW array makes 1 kWh per peak sun hour, but real installs lose 15–25% to inverter efficiency, wiring, heat, soiling, and less-than-perfect orientation. Using 0.80 keeps your estimate honest.
To go from a target — "I want to offset my whole bill" — to a panel count, see how many solar panels you need.
How Many Sun Hours Do Solar Panels Need?
Solar panels generate some power any time there's daylight, but for a system to make strong financial sense you generally want at least 4 peak sun hours per day. In lower-sun regions (the Pacific Northwest, the far North) solar still works — you just size up the array or add battery storage to hit the same energy target.
What matters even more than the raw number is quality of exposure:
- Direction: Face panels south (in the Northern Hemisphere) for the most annual energy.
- Shade: Just a little shade hurts a lot. Cells are wired in series strings, so one shaded cell drags down the whole string. Aim for an unshaded area, or use MPPT (maximum power point tracking) inverters/optimizers to limit partial-shade losses.
- Angle: Tilt affects seasonal output — find your optimal tilt and azimuth angle to squeeze out more production.

Peak Sun Hours Outside the US
Peak sun hours work exactly the same way anywhere on Earth — one hour at 1,000 W/m² — only the numbers change with latitude, elevation, and climate. A few reference points for common searches:
- Southern Spain (Andalusia, Almería): among Europe's sunniest regions, averaging roughly 5–5.5 peak sun hours/day over the year — comparable to the U.S. Sun Belt.
- Northern Europe & the UK: typically 2.5–3.5 peak sun hours/day, so systems there are sized larger to hit the same energy target.
- Equatorial regions: steadier year-round sun, often 4.5–6 peak sun hours/day with far less seasonal swing.
For a location-specific figure anywhere in the world, the free Global Solar Atlas maps irradiance worldwide. Doing an international project? Email your location to sales@unboundsolar.com and we'll pull the insolation data and help you size it.
Why the Sun Hours Map Is Only a Starting Point
Here's the honest truth most sun-hour pages won't tell you: a peak sun hours map assumes near-perfect conditions. It's a genuinely useful ballpark — especially if you're on a tight budget and just want to know whether solar is worth exploring — but your real-world production depends on factors a national average can't see:
- Roof pitch and direction (azimuth): A steep north-facing plane and a gentle south-facing one in the same ZIP code can differ by 30%+ in annual output.
- Shading: Trees, chimneys, dormers, and neighboring buildings cast shade that changes hour by hour and season by season. This is where a generic number breaks down most.
- Weather and cloud patterns: Two cities at identical latitude can have very different real irradiance because of marine layer, monsoon season, or persistent cloud cover.
- Seasonality: Yearly averages hide the swing. Winter daily solar gain can be 25–50% lower than the annual average — critical if you're going off-grid and must cover the darkest month.
- Code setbacks: Fire and ridge setbacks required by code differ by jurisdiction and quietly shrink the roof you can actually use. Plenty of people plan around roof space a permit office won't let them fill.
- Net metering & local utility rules: What your utility actually pays for the power you export — full-retail net metering, a lower net-billing rate, or nothing at all — swings your true ROI and the right system size. These policies vary by utility and change often, so the payback math is different on nearly every street. A technician who knows your local jurisdiction and utility can size the system around the rules that actually apply to you.
- Your usage — now and future: An EV, a heat pump, a hot tub, or a home addition can reshape how big your system should be.
This is where working with an experienced solar technician pays off. Professional design tools go far beyond a map — they use LiDAR-based shade analysis, exact roof-plane geometry, local weather modeling, and seasonality to model your roof, then size the system around your real consumption and future plans, with the local setback rules baked in. A map gives you a ballpark; an engineered design gives you a number you can build a budget on.
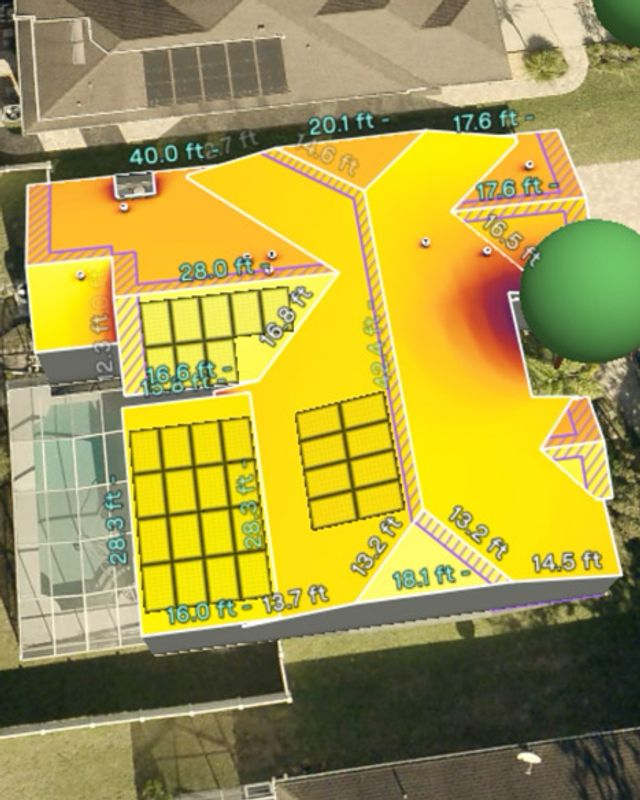
Get a Real Production Estimate for Your Roof or Ground
Ready to move past the ballpark? Here's the simple path:
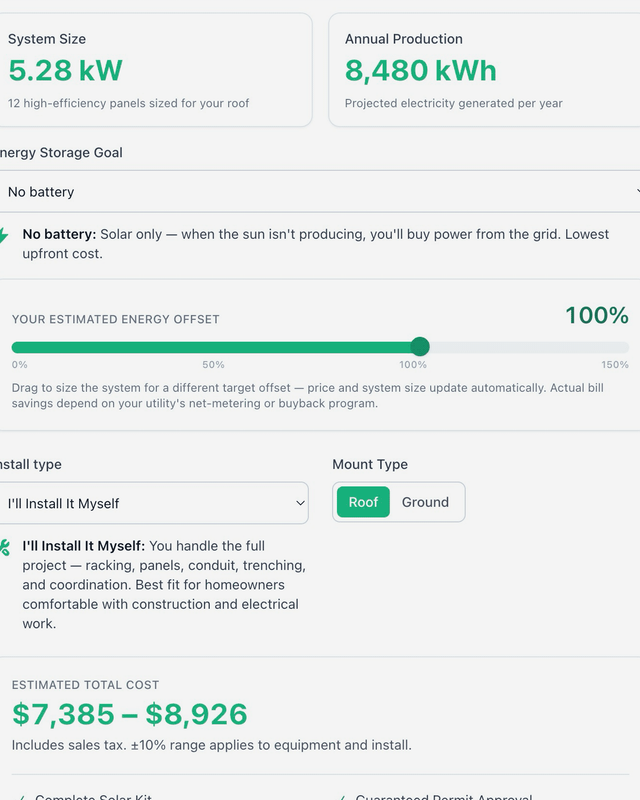
- Get a free solar estimate. Our free estimator factors in the big variables and gives you a real starting report — no cost, no obligation.
- Review your free report. See an estimated system size, production, and price range dialed to your location.
- Talk to an expert (if it makes sense). One of our experienced solar technicians can refine the design using shade analysis and your actual usage — and answer every question before you spend a dollar.
New to all of this? Start with our Getting Started with Solar guide. Ready to see hardware? Shop complete solar kits or size an off-grid setup with our off-grid system sizing calculator.
Prefer to talk it through? Call us at 1-800-472-1142 or email sales@unboundsolar.com with your project location and we'll help you design your system.
A Map Gets You Close. We Get You Right.
A peak sun hours number is a great starting point, but a system you actually build needs irradiance mapping, LiDAR shade analysis, and your exact roof angle and azimuth to place panels well — plus the fire and ridge setbacks your local code requires, which quietly shrink the roof you thought you had and sink permits when they're missed. For 20 years we've helped both DIYers and professional installers get that right, with professional-grade equipment and the best value on gear done properly. Start low-pressure: see what a complete kit would cost, then talk to a technician only if it fits your budget and goals. You're not doing this alone.
More Relevant Topics & Resources
Questions people actually ask
Straight answers, sourced from real searches.
A peak sun hour is one hour during which sunlight intensity averages 1,000 watts per square meter (1 kW/m2) — the standard test intensity solar panels are rated at. It packs a whole day's varying sunlight into an equivalent number of full-strength hours. If your location receives 5 kWh/m2 of sunlight in a day, that's 5 peak sun hours, even though the sun may be up for 12+ hours.
"Perfect" or peak sun hours describe sunlight at its full reference intensity of 1,000 watts per square meter — the same condition panels are lab-rated under. No real location has sun that strong all day, so peak sun hours instead express a day's total solar energy as an equivalent number of full-intensity hours (usually 3-6 across the US).
Sunlight intensity peaks at solar noon — when the sun is highest in the sky (not necessarily clock noon). The strongest window for solar production is roughly 10 a.m. to 2 p.m. Peak sun hours aren't a clock time, though — they're a daily total of full-intensity sunlight, so a location can bank 5 peak sun hours from light spread across the whole day.
Most of the continental U.S. averages about 4 to 4.5 peak sun hours per day. The desert Southwest (Arizona, New Mexico, Nevada) tops 6, while the Pacific Northwest and Alaska run closer to 3.5. Find your state in the table above, or enter your address in NREL's free PVWatts tool for a location-specific number.
Solar panels produce power any time there's daylight — there's no strict minimum. Whether solar pays off depends more on your electricity rates and local incentives than on raw sun hours: a cloudier state with expensive power and good incentives often beats a sunny one with cheap power. In lower-sun areas you simply add more panels to hit your energy target. What matters most on your roof is unshaded, south-facing exposure during the 10 a.m.-2 p.m. window.
Multiply your system size (in kW) by your daily peak sun hours, then by a real-world derate factor of about 0.75-0.85 to account for losses. Example: a 5 kW system in a 5 PSH location makes roughly 5 x 5 x 0.80 = about 20 kWh per day, or about 7,300 kWh per year.
No. Daylight is every hour the sun is above the horizon; peak sun hours count only the equivalent hours at full 1,000 W/m2 intensity. A summer day might have 14 hours of daylight but only 6 peak sun hours, because early-morning and late-evening light is too weak to count for much.
The soft, warm light in the roughly 30-60 minutes before sunset (and after sunrise) is called the golden hour. It's beautiful for photos but nearly worthless for solar production — sunlight that low in the sky is far below the 1,000 W/m2 threshold, which is exactly why peak sun hours ignore it.
It's a great starting point, but it assumes ideal conditions. Your actual production depends on roof pitch and direction, shading, local weather and cloud patterns, panel efficiency, and seasonal swing. Use the map for a ballpark, then get a location-specific estimate (from NREL PVWatts or an Unbound technician using LiDAR shade data and your real usage) before you buy.
A Map Gets You Close. We Get You Right.
A peak sun hours number is a great starting point, but a system you actually build needs irradiance mapping, LiDAR shade analysis, and your exact roof angle and azimuth to place panels well — plus the fire and ridge setbacks your local code requires, which quietly shrink the roof you thought you had and sink permits when they're missed. For 20 years we've helped both DIYers and professional installers get that right with professional-grade equipment and the best value on gear done properly. Start low-pressure: see what a complete kit would cost, then talk to a technician only if it fits your budget and goals. You're not doing this alone.